RED-ACT-Report: 04-28 M5.6 Japan Tokachi-chiho
RED-ACT Report
Real-time Earthquake Damage Assessment using City-scale Time-history analysis
Apr. 28, M5.6 Japan Tokachi-chiho Nambu Earthquake
Research group of Xinzheng Lu at Tsinghua University (luxz@tsinghua.edu.cn)
First reported at 03:30, Apr. 28, 2019 (Beijing Time, UTC +8)
Acknowledgments and Disclaimer
The authors are grateful for the data provided by K-NET and KiK-net. This analysis is for research only. The actual damage resulting from the earthquake should be determined according to the site investigation.
Scientific background of this report can be found at:
http://www.luxinzheng.net/software/Real-Time_Report.pdf
1. Introduction to the earthquake event
At 02:25 28 Apr 2019 (Local Time, UTC +9), an M 5.6 (JMA) earthquake occurred in Japan Tokachi-chiho Nambu. The epicenter was located at 142.9 42.5, with a depth of 110.0 km.
2. Recorded ground motions
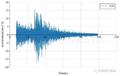
33 ground motions near to epicenter of this earthquake were analyzed. The names and locations of the stations can be found Table 1. The maximal recorded peak ground acceleration (PGA) is 126 cm/s/s. The corresponding response spectra in comparison with the design spectra specified in the Chinese Code for Seismic Design of Buildings are shown in Figure 1.


Figure 1 Response spectra of the recorded ground motions with maximal PGA
3. Damage analysis of the target region subjected to the recorded ground motions
Using the real-time ground motions obtained from the strong motion networks and the city-scale nonlinear time-history analysis (see the Appendix of this report), the damage ratios of buildings located in different places can be obtained. The building damage distribution and the human uncomfortableness distribution near to different stations is shown in Figure 2 and Figure 3, respectively. These outcomes can provide a reference for post-earthquake rescue work.

Figure 2 Damage ratio distribution of the buildings near to different stations

Figure 3 Human uncomfortableness distribution near to different stations
4. Earthquake-induced landslide of the target region subjected to the recorded ground motions
According to local topographic data, lithology data and ground motion records, the distribution of earthquake-induced landslide near to different stations under the different proportions of the landslide slab thickness that is saturated can be calculated, as shown in Figure 4. The basemap shows the distribution of the local slope. The number in the circle represents the critical slope of the landslide. The earthquake-induced landslide tends to occur with a higher probability when the slope is larger than this threshold value.

(a) The proportion of the landslide slab thickness that is saturated equals 0%

(b) The proportion of the landslide slab thickness that is saturated equals 50%

(c) The proportion of the landslide slab thickness that is saturated equals 90%
Figure 4 Distribution of earthquake-induced landslide near to different stations
Scientific background of this report can be found at: http://www.luxinzheng.net/software/Real-Time_Report.pdf
Table 1 Names and locations of the strong motion stations
No. Station Name Longitude Latitude
1 AOM01020190428022531 141.142 40.8721
2 HKD07120190428022526 145.26 43.2326
3 HKD07520190428022522 145.029 43.1309
4 HKD07820190428022456 144.498 43.1486
5 HKD08520190428022453 144.07 42.9581
6 HKD08920190428022452 143.554 43.2436
7 HKD09020190428022451 143.618 43.1213
8 HKD09120190428022450 143.659 42.8087
9 HKD09220190428022451 143.448 42.9283
10 HKD09520190428022448 143.214 42.9311
11 HKD09620190428022449 143.136 42.6975
12 HKD09720190428022448 143.421 42.6181
13 HKD09820190428022448 143.279 42.4984
14 HKD09920190428022453 142.839 43.0736
15 HKD10020190428022448 143.312 42.2864
16 HKD10320190428022455 142.297 42.7275
17 HKD10420190428022449 142.131 42.5886
18 HKD10520190428022449 142.054 42.4825
19 HKD10620190428022452 142.369 42.3414
20 HKD10820190428022448 142.564 42.2528
21 HKD10920190428022448 142.767 42.1678
22 HKD11320190428022449 143.315 42.1287
23 HKD12120190428022454 141.855 43.3332
24 HKD12520190428022450 142.135 42.7608
25 HKD12620190428022451 141.928 42.575
26 HKD12720190428022451 141.82 42.8741
27 HKD12820190428022451 141.822 42.7655
28 HKD12920190428022508 141.606 42.6344
29 HKD15820190428022457 141.141 41.8345
30 HKD18120190428022454 141.546 43.1161
31 HKD18220190428022454 141.552 42.9925
32 HKD18420190428022452 141.601 42.79
33 HKD18520190428022453 141.402 42.7755
---End---
相关研究
相关文章,在仿真秀官网搜索:
场地-城市耦合弹塑性分析+神威太湖之光+无人机 | 三项黑科技助力新北川县城震害预测
层间位移角判别准则不适用于剪力墙,怎么办?|新论文:基于曲率的剪力墙损伤评估方法
新论文:结合BIM和FEMA P-58的建筑地震损失预测方法
新论文:地震-连续倒塌综合防御组合框架结构体系研究
新论文:扔砖头、跳盒子,这也是做科学试验哦!| 地震次生坠物情境中的人员疏散模拟
新论文:改变框架-核心筒结构剪力调整策略对其抗震性能影响的研究
综述:城市抗震弹塑性分析及其工程应用
新论文:适用于多LOD BIM的建筑地震损失评估
新论文:新型地震和连续倒塌综合防御韧性PC框架承载力计算方法
新论文:角柱失效后平板结构连续倒塌行为实验研究
新论文:城市建筑群多LOD震害模拟及北京CBD算例
美国NSF SimCenter+清华城市弹塑性分析=旧金山184万建筑地震模拟
新论文:受折纸启发的可更换承载-耗能双功能耗能器
新综述论文:21世纪建筑结构连续倒塌和鲁棒性的研究和实践
新论文:中柱失效后板柱结构连续倒塌传力机理研究
新论文:一根钢筋混凝土梁,承载力你能算对么?| 梁的压拱效应计算方法
新论文:无人机+机器学习+城市弹塑性分析=震后近实时损失预测
新论文:这个混凝土框架能抗震,能防连续倒塌,还功能可恢复,您不进来看看么?
新论文:一个好汉三个帮|带端部阻尼器伸臂桁架的抗震性能试验研究
新论文:BIM+新一代性能化设计=喷淋系统破坏后的地震次生火灾模拟
新论文:村镇建筑群火灾蔓延模拟与案例
新论文:建设地震韧性城市所面临的挑战
新论文:烈焰焚城 | 地震次生火灾的精细化和高真实感模拟
新论文:城市韧性——基于“三度空间下系统的系统”的思考
新论文:防屈曲支撑伸臂桁架?几个“狗骨头”可少不了!
新论文:城市抗震弹塑性分析中如何确定高层建筑的损伤程度?
新论文:考虑楼板影响的钢筋混凝土框架边柱连续倒塌试验
新论文:提高地震荷载分项系数,抗震安全性提高了多少?
新论文:采用减振子结构来控制超高层建筑的地震楼面加速度
新论文:500m级超高层建筑简化模型及其在结构体系对比中的应用
606m 超高层建筑OpenSees模型


