Vehicle Restraint System optimization

Vehicle Restraint System optimization using MeshWorks
Vehicle Restraint System optimization and robustness assessment using the coupling between LS-DYNA, LS-OPT and DEP MeshWorks software
C. GOUBEL1, J.Y. GOUIFFES2, T. MAILLOT1, V. LAPOUJADE1, M. SEULIN1, N. VAN DORSSELAER1
1DynaS+, Grenoble/Toulouse - France
2ROUSSEAU Equipements, Lanrodec - France
Introduction
Road safety structures are CE (European Commission) marked safety systems which need to be crash tested. Structure performances during the crash tests and the associated rating have a significant marketing impact for the system manufacturer and unfortunately depend on parameters subjected to stochastic variation (raw material mechanical properties, test conditions, vehicle design,…).
Numerical simulation has been widely used for several decades to assist in the design of these new road safety devices. Historically, in order to identify a design likely to pass the experimental tests, simulation has mostly been used without taking into account the variability of the modelled system parameters but only its nominal design. However, in too many cases, the great variability of such devices (materials characteristics, ground type, assembly conditions, impact parameters, etc…) leads to unexpected behaviour (and results) and jeopardizes the test validation.
In the following sections the full process of one road safety system optimization will be presented starting with the correlation between the numerical model results and the corresponding real crash test results.
Then, a design optimization on a reduced model will be performed using an innovative approach based on an advanced use of the DEP MeshWorks morphing capabilities coupled with LS-OPT© and LS-DYNA©.
Finally, based on the optimal design found previously, an additional sensitivity study using LS-OPT and LS-DYNA will be conducted to better assess the device robustness and its sensitivity to material characteristics changes. The aim is to enable designers of new systems to better assess the risk of failure when performing the experimental tests required by the standard.
Model correlation
Description of OVALIE Vehicle Restraint System


Fig.1: Ovalie H2 (TB51 left – TB11 middle – Numerical model left)
OVALIE from ROUSSEAU is a H2 Vehicle Restraint System according to EN1317 definition. It means that this device, designed for bridges, is able to restrain a 13t bus running at 70 km/h under a 20° impact angle (TB51) as well as 900kg light car running at 100 km/h under the same 20° impact angle (TB11).
The development of this device was made during 2009-2011 in order to obtain a CE marked product so as to replace the French Generic device (BN4) for new bridges construction.
In particular the device anchorage on the bridge structure has been kept as very specific and common to the French bridges.
The complexity of the structure optimization is due to the duality of the crash configurations. On one hand, the structure has to be stiff to redirect a heavy vehicle and, on the other hand, has to be not too aggressive with for light vehicle passenger.
For this purpose, the device has been imagined with two main stages: the lower one with an energy absorber specifically designed for light vehicles and an upper one to restrain heavy vehicles.
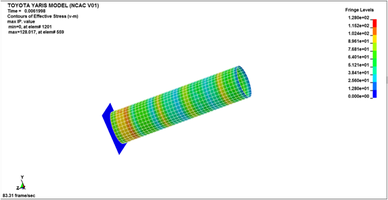
Numerical model
The numerical model has been fully developed using DEP MESHWORKS software. The device has been modelled using shell elements. A total of around 350 000 finite elements make the 60 meters length model.
The bolted connections are meshed using solid rigid elements for bolt heads and nuts and spotweld beam elements to represent the bolt bodies. An initial axial force is imposed on each bolt in order to represent the tightening torque.
The 150mm high concrete beam is modelled using rigid solid elements.
The mechanical properties of the different components are modelled using a bi-linear behaviour law fed with the results of material characterisation tests performed after the crash test as requested by EN1317.

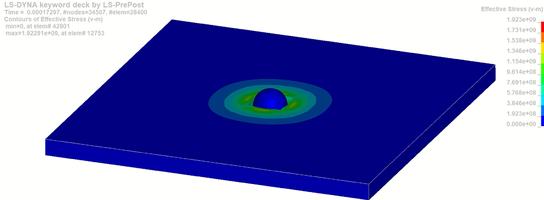
Fig.2: Comparison of structures after impact
Figure 2 shows the good correlation of the numerical model results with the experimental results. In particular, one can notice the specific behaviour of the twisted upper rail, and the position of the two disconnected posts. Post number 11, after a direct contact with the bus structure, detached from the bridge structure (fusible anchorages) and slid along the rails (sliding connection) until reaching an upper rail junction where the sliding connection broke disconnecting the post from the upper rail. The following post (number 12) also slid along the rails till meeting the next post which finally stopped its translation. This very specific behaviour can only be obtained with proper combination of correct mechanical properties of different components and proper geometrical dimension of the impacting bus
(especially the front bumper vertical position). These parameters are unfortunately unknown before performing the actual crash tests.
EN1317 Performances comparison

Fig.3: n1317 Dynamic Deflection and Working Width
Crash test | Numerical model | CEN TR16303 validation tolerances | |
Dynamic Deflection | Dm=0.7m | Dm=0.7m | ±0.2m |
Working width | Wm=1.5m | Wm=1.2m | ±0.2m |
Working width class | W5 (≤1.7m) | W4 (≤1.4m) | |
Vehicle Intrusion | 0.8m | 0.9m | ±0.4m |
Table 1: Comparison of TB51 performances
Table 1 highlight a good comparison between the experiment and the numerical model for dynamic deflection and vehicle intrusion which respectively correspond to the maximum dynamic displacement of the device front face (vehicle side) and the maximum intrusion of the vehicle with respect to the undeformed device.
Nevertheless Table 1 also shows a poor comparison as far as working width is concerned. In this crash test, working width which is the maximum distance between any part of the device and the traffic face, is given by the disconnected post which was, at the end of the crash test, lying on the floor
Once the post has detached from the bridge deck and disconnected from the top rail, ist behaviour becomes uncertain. The post randomly moves around ist remaining middle connection. Then, the working width can not be a relevant criteria anymore to characterize the reliability of the model, when compared with the crash experiments.
Unfortunately this post behavior significantly degrades the working width performance and has a huge economical impact on the device. Thus, starting from this correlated model, a design optimization will be performed with the aim of obtaining better performances.
Device optimization
Morphing definition
In order to explore several designs and find one optimum, it has been decided to use the capabilities of DEP MeshWorks and LS-OPT coupling.
So as to limit the optimisation study computation time, this phase of the work is made on a reduced model (6 posts 17.5 meters length model) with boundary conditions on rail extremities. Furthermore, the calculation are run in single precision and the final time is reduced from 1.5s to 1s. The
combination of all these modifications enables to reduce the time requested for one simulation from 45h to 14h (on 28 CPUs using a MPP version of LS-DYNA solver).
DEP MeshWorks is a feature based morphing tool that can rapidly morph existing Finite Element (FE) models to match new geometry and/or to new proportions. A wide variety of morphing techniques such as control block (lower & higher order), direct parabolic, spherical, polycube and field based morphing are available to address varied applications.
An extensive set of automated and interactive tools to create ‘control blocks’ for assembly level morphing is available.

Fig.4: Control Blocks definition
After the creation of the according control blocks, the user can easily set the morphing relationships between control nodes (nodes directly moving according to a specified transformation) and the deformable nodes (nodes smoothly following the control nodes in their movement according to interpolation relationships between the nodes).
Then, once the morphing set up has been defined, the various expected transformations of the FE model can be applied.
The definition of the transformation automatically leads the definition of a scalar numerical parameter which will be “called” thereafter by LS-OPT.
The following table shows each parameter and the combination of all maximum transformation which is a 150mm displacement.


Initial Desin | Post Width | Top Rail Height | Top Rail Lateral position |
Post width=0 Top Rail Height =0 Top Rail Lateral position =0 | Post width=-150mm Top Rail Height =0 Top Rail Lateral position =0 | Post width=-150mm Top Rail Height =-150mm Top Rail Lateral position =0 | Post width=-150mm Top Rail Height =-150mm Top Rail Lateral position =-150mm |
Table 2: Morphing parameter definition
LS-OPT optimization study

Fig.5: LS-OPT study definition
A Meta-Model based single stage optimization study is defined using a Feedforward Neural Network meta-model with a 20 points space-filling sampling (default was 16 for a 3 variables problem). There are 3 parameters defined for this optimization study that correspond to the three transformation operations specified previously in the MeshWorks phase.
A specific step “MW_stage” is calling DEP MeshWorks in order to generate the required designs, based on the sampling done by LS-OPT (one barrier mesh is generated by MeshWorks for each parameters sample).
In the Impact_bus stage, the 20 simulations are run with LS-DYNA MPP solver (simple precision) and the performances of the device (dynamic deflection and working width) are automatically extracted by LS-OPT. The first criterion uses a simple formula available in LS-OPT and the second one calls a Ls- PrePost script to get the result. The post-treatment of these performances, which usually requires a non-negligible time, is here very accurate and automated (so as to save time).
Main results

Fig.6: Meta-Model accuracy for Dynamic deflection (top) and working width(bottom)
AS shown in Figure 6, precision and predictability of the chosen metamodel is quite good for the main two responses of the model (Dynamic deflection and working width). Results obtained with this metamodel can be checked out more precisely.

Fig.7: Sensitivities
Figure 7 points out that the Top Rail Height parameter is the one that most affect the working width performance. On the contrary, this parameter has the least impact on the dynamic deflection response. The objective of the study is to reduce the working width measurement without degrading the dynamic deflection. Consequently, this parameter is logically the one that mostly characterised the optimal design.

Fig.8: Response surface at maximum Top Rail Lateral position for Dynamic Deflection (left) and working width(right) as a function of Top Rail Height and Post Width.
Response surfaces are highly non linear as illustrated on figure 8. The optimal design is obtained for the lowest top rail position (-150mm) without any change in lateral position or post width.
Monte Carlo analysis
Before carrying out with any crash testing of this optimal design, a Monte Carlo analysis should be performed to assess its robustness. In fact, Vehicle Restraint Systems performances are highly
affected by variation of the mechanical properties variation which are difficult to control. One approach is to consider the failure modes of the structure and to analyse the influence of the possible variation of the mechanical properties that affect the activation of each failure mode. For instance, the failures modes identified for OVALIE under TB51 loading, are the bending of the upper rail, the transfer of the contact forces through the post to the fusible anchorages.
The related mechanical properties are the yield stress for rail and post steel, the tensile stress of the anchorage’s bolts.
A Monte Carlo based sensitivity analysis has been set-up with these three variables for which a uniform distribution has been chosen. The meta model is again a Feedforward Neural Network which give a good accuracy and predictability as illustrated below.

Fig.9: Accuracy of Feed Forward Neural Network metamodel

Fig.10: Sensitivity analysis
As shown on Figure 9, the sensitivity study highlights that the anchorage tensile stress (rmfus1) is the most important parameter that drives the performances of the device.

Fig.11: Scatter plot : Performances as a function of anchorages tensile stress
The tensile stress range of variation has been given by the physical value tolerances 450±50 MPa. This variability leads to a variation of working width from 0.6m up to 1.15m.
This unfortunately highlights the difficulty of getting this design to work as expected and the need for a parametric study prior to crash test in order to ensure the design reliability and avoid unanticipated results.
This kind of numerical study can be really useful to support design strategies and product development choices. Depending on the robustness study results the manufacturer can either choose to keep its design, but eventually add some monitoring steps during the design production, or choose to go back to the optimisation process so as to get a more robust design.
Summary
This paper illustrates the full process of a Vehicle Restraint System development. After a correlation with real crash test results on an existing design, an optimal design has been found using a smart coupling between DEP MeshWorks morphing capabilities and LS-OPT.
LS-OPT and LS-PrePost were used to post-process the results and compute EN1317 performances without user intervention.
At last, a sensitivity analysis has been performed on the optimal design by varying the mechanical properties that affect the failure modes of the structures.